


Some nights one just has to sit down, pour a cold beverage, read the news and statistics and sigh. The headlines are hilarious in the financial media because everything is a headline, sort of like the old comic sections in print newspapers, and yes, I’m old enough to remember reading Bloom County and getting my wisdom of the day from Opus along with Bill the Cat.
Which reminds me after reading today’s Bureau of Labor Statistics TDS (Trump Derived Statistics) CPI report, it can be summed up in one word:


Ack is right. It’s a hairball projectile created through statistical magic since 2004 roughly only to be imputed to new levels of fantasy to accommodate the political flavor of the day in charge at the White House and their friends on Wall Street. And no my few readers of the Marxist left, your boy Senile Joe never got a pass from me either.
This brings my friends to these hallowed pages to find out why someone has to be a skeptic about inflation, despite my second half predictions for this year, and why the report today was so artificially tame.
I. There’s Lies, Damned Lies, and Arts of Work by the BLS
Sometimes one has to admire the statistical pretzels the economic staff at the BLS twist themselves in to so they can create artificial realities that only those ingesting massive quantities of ketamine or LSD could understand.
For example, somehow every part of a pig got more expensive except for what?
The pork belly.
This chart excerpted from Investing.com doesn’t due justice to what the BLS said this morning:


But what does the BLS Unicorn AS400 report pump out today?


So the rest of the pig costs more than the bacon? To make a hot dog requires a substantial portion of the pig leftovers (I’ve visited the Oscar Mayer plant so I know), which is not given any weighting significance costs more than sausage and bacon year over year, but it’s no big deal to ignore one of the most enjoyable and consumed meats, the hot dog, in the United States when measuring inflation?
Perhaps my readers would like to read some more of why my statistical analysis professor in college would call “creative destinations” from today’s report. Like this beauty:
Used cars down 1.8% year over year (nsa) but up 1.6% since May.
Yet if one talks to anyone in the business, prices are moving much higher and shortages of vehicles people really want are starting to appear. From Autobody News via an article from July 13, 2026:
Wholesale used-vehicle prices, a figure collision repair shops track for its effect on total loss decisions, grew at a slower year-over-year pace in June than earlier in 2026, according to the Manheim Used Vehicle Value Index published by Cox Automotive.
The index rose to 212.9 in June, up 2.1% from a year earlier and 0.1% from May, according to the report. On a non-adjusted basis, wholesale prices were up 2.9% year over year and down 1.3% from May. The year-over-year gain marked a slowdown from May’s 3.6% increase, according to Jonathan Gregory, senior director of Economic and Industry Insights at Cox Automotive.
The price pass through hit the retail market as Auto Remarketing stated on June 29th:
Growth slows in June, but used-car retail prices still up four figures from start of 2026
Excerpt:
The sequential rise in used-vehicle prices has slowed but continued in June, capping a first half that has prices four figures higher than they were to start the year.
That’s according to analysis around the latest CARFAX Used Car Index, which indicates used-car prices this month have climbed by about 1.3%, or a little more than $350.
That down from May’s month-over-month gain of more than 3% or nearly $900.
Despite the slowdown in growth for June, used-car prices have escalated “dramatically” for some segments during the first half, CARFAX said.
The prices of used pickup trucks, luxury cars and SUV are up more than $1,500 since the beginning of the year, while used van/minivan prices are up more than $2,000, CARFAX said.
And there’s been nearly a $2,800 spike in used luxury SUVs.
Thus while the rate of inflation has slowed month over month, for the year it is higher and will only skyrocket further as the lower leg of the “K” Wall Street ignores seeks affordable alternatives to the overpriced new vehicles being forced on to an unwilling US consumer.
But why is the data so out of tune with Main Street?
II. We Call it Blind Darts, They Call it Imputation
There is a weird situation being attributed to the now common cold/flu version 2.0, aka, Covid. It’s now acceptable to use “imputed” or “guesses” as official statistical reports even though modern technology provides visibly obvious rates of price change that even a moron government employee could use.
What in the world is this bitter civilian who couldn’t retire at 55 with a 40 year plus government pension and elite medical care talking about?
I can log into my Walmart or Publix online account and guess what? I can see what I paid for an item a year ago and then compare it to today’s prices. And believe it or not boys and girls, using basic math that apparently is beyond the grasp of both political parties, one can calculate the rate of inflation or how much more Mr. and Mrs. Average Main Street is paying more or less for products on an annualized basis.
One’s eyeballs might seem to be enough like an item that was $1.00 at the Dollar Tree two years ago is now $1.50 so that does tend to validate that perhaps there are a lot of increases of 25% per year.
Wow. Math. Amazing.
But wait, it’s worse.
Per the BLS own reporting, here is the reality of the data that billions of dollars depends on every month:
For the June 2026 CPI report (released today, July 14, 2026, covering data through June), roughly 39-40% of the Commodities and Services (C&S) survey prices were imputed (estimated rather than directly observed).
BLS publishes detailed imputation breakdowns on its site (updated today for June 2026 data):
Commodities & Services (C&S) survey (covers most non-housing items):
June 2026: 61% home cell imputation (using similar items in the same area), 39% different cell imputation (broader area), 0% carry-forward. This has hovered around 37-40% total imputation recently.Housing survey (rent and owners’ equivalent rent, a large CPI weight):
June 2026: 91% non-interview (imputed from similar units), 9% vacancy. Nearly all housing data involves imputation due to the survey’s nature (ongoing rents aren’t re-collected monthly for every unit).
In other words, about 4 out of 10 data points are made up nonsense with regards to commodities and services that the American people know cost more but due to political pressure, laziness, or an unwillingness to update methodology, the BLS says “here it is now buy more semis!”
The Housing survey is worse because good God if they take the data from the Housing industry the fertilizer stench doesn’t begin to describe it. The imputation is only used because why bother reviewing openly available data sources from states, counties, and numerous commercial sources which would provide much more accurate regional information.
III. Promote the Narrative- OR ELSE!
This author was tempted to write another paragraph on the fallacy of seasonal adjustments for about the 1,000th time, but instead, let’s demonstrate the narrative promotion engaged in by Wall Street, the media, and of course America’s political elites. Not to report the real price issues facing the lower castes in the US economy, you know, the “poors”, but to highlight just how effective the practices of Bernays real can be.
The following stories have appeared on this blog almost annually, sometimes several times a year which highlight the narrative is more important than the reality:
May 2022: The Inflation is Over Myth
My favorite chart from that article:


And of course the best article from that story: 1975: Start of Recovery, Easing of Inflation and U.S. Tax Cuts
See how that works?
July 2022: The Propaganda of Peak Inflation
The headline there?

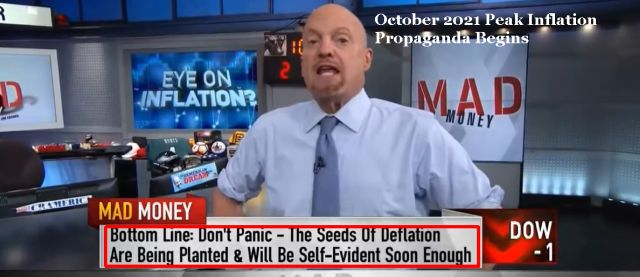
Those were the days.
June 2023: Today’s Inflation Report Was Not as Great as Advertised
Still isn’t, 3 years later.
October 2024: Inflation is Under Control, Unless You Eat, Drink, Need a Doctor, or Drive a Car
My own research provided these beauties for an excerpt:
Is U.S. inflation finally under control? – Baton Rouge Business Report October 10, 2024
Inflation in September 2024 cools to its lowest level since February 2021 – NBC News October 10, 2024
Inflation Continues to Decline, Beating Forecasts – US News and World Report September 27, 2024
U.S. inflation reaches lowest point in 3 years, though some price pressures remain – AP October 12, 2024
US inflation still slowing, but not fast enough for seniors – Oxford Economics October 11, 2024
U.S. inflation reaches lowest point in three years – Microsoft News(MSN) October 10, 2024
Ouch. Two years, one election later it still sucks.
December 2024: America’s 80/20 Recession
Too bad no one on Wall Street, K Street, or in the media cares about the 80%.
July 2025: Consumer Inflation Has Begun it’s Tariff Spike
Despite a brief respite after the Supreme Court ruling, as these pages highlighted several days ago, the tariff nightmare is returning. Yet the media refuses to cover it with any detail. But outside of eggs, last July the impacts are still being felt and the idea that the price changes highlighted last July are going to start deflating in the next 60 days is a Chappelle comedy routine inspired crack pipe dream.


This actually highlights the sticky-CPI problem the Fed is facing as there is no real indication that the problem of cumulative inflation from the last six years is going to start diminishing any time soon.
IV. A Sad Conclusion
Barring a miracle from the the new regime at the Fed, the inflation problem will remain sticky but thankfully gets corrected by the ultimate demand destruction the lower 90% of the economy will feel as prices and war weariness finally exhaust Americans of the circus in power now and demand a new ringleader to reign in the stupidity. Unfortunately a lurch to the left will be parallel to the events of the 1930 election and that’s where the future becomes murky at best, tragic in all probability.
The Federal Reserve will have to over take the fiscal dominance of the past 14 months and re-assert control of monetary policy or a disaster of epic, hell, demographically inspired deflationary of Japanese proportions will wash across our shores. Regardless of whatever pie in the sky data points received from the media and mediocracy in DC, reality still dictates behavior and until deflation, actual visible price decrease happen, there will be no relief for the American consumer until late in 2027.
Sadly, it means deflation also as to hit the one area nobody discussed from today’s economic data. From the BLS website:
REAL EARNINGS – JUNE 2026

All employees

Real average hourly earnings for all employees increased 0.8 percent from May to June, seasonally
adjusted, the U.S. Bureau of Labor Statistics reported today. This result stems from an increase of 0.3
percent in average hourly earnings combined with a decrease of 0.4 percent in the Consumer Price Index
for All Urban Consumers (CPI-U).

Real average weekly earnings increased 0.8 percent over the month due to the change in real average
hourly earnings combined with no change in the average workweek.
This ends poorly unless real earnings decline:


Prepare for pain and lots of it.
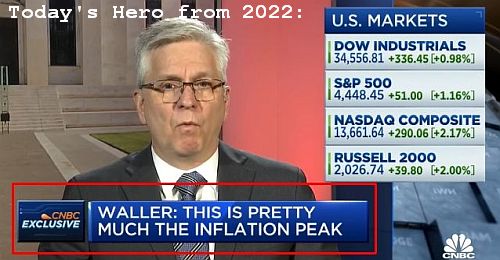
Or listen to jack-wagons like Waller who said in May of 2022 we had hit peak inflation and it was over.