While the Jim Cramer inverse alert indicator might be called the most reliable crash indicator in the history of capitalism, there is another actual data point which tick by tick could warn investors that Armageddon Day has arrived.
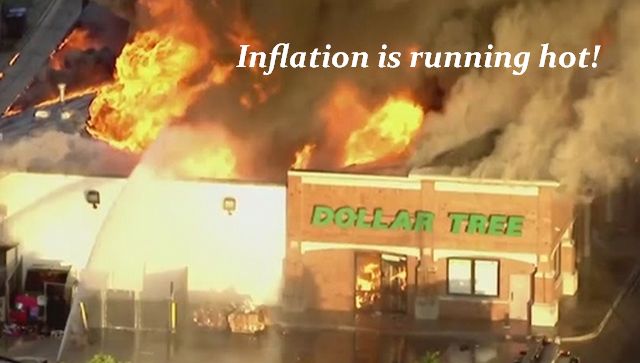
The more practical talking heads all say to watch moving averages, advance-decline indicators, etc. While technical analysis is a useful tool, when the world is on fire it is nothing more than a fire alarm after the building is consumed.
I prefer something simple and elegant and this one chart says it all:
The United States 10 year Treasury yield broke above 4% briefly early this morning after an astounding 20 bps move since last Friday. With the markets closed yesterday it would appear someone in Asia needed to liquidate their holdings and fast. If the US Treasury bond markets continue to exhibit illiquidity, there is a real danger of sustained move above 4% on the 10 year and much, much higher on the 2 year yield.
Hence when that happens, look for equities and commodities to follow, and by follow I mean crash hard with a 10% plus move on extreme volume. Starting today, this threat is real and in play for at least the next three weeks.
Buckle up folks, it’s about to get real bumpy.


