UPDATE 15:35 ET-
Thankfully they fixed it. After accelerating flight delays at Fort Myers, Fort Lauderdale, Miami, Orlando, and West Palm Beach, the FAA managed to get the Commodore 64 purring again.

Good thing it’s now official throughout the system.
———————————————-
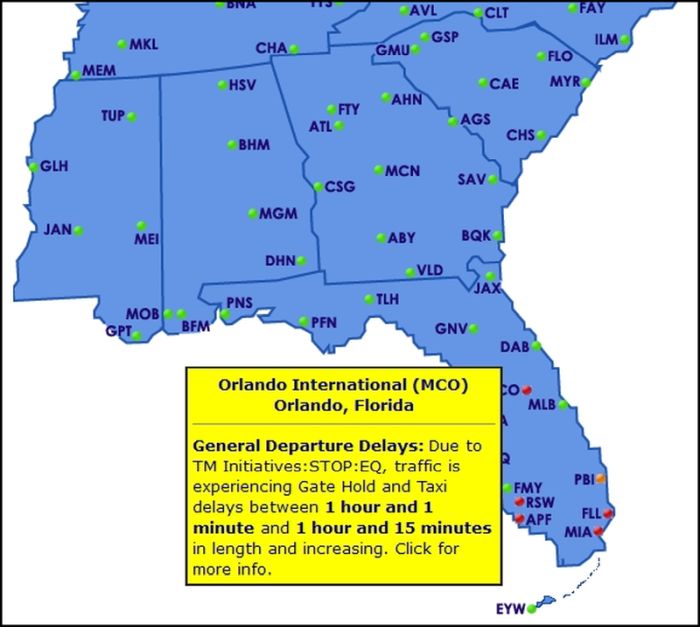
This is not going to end well on a very busy travel day as vacations are coming to an end. Heads up provided by RawAlerts on Twitter:

As always with Twitter, trust but verify and here it is from the FAA/ATC website:


Good thing the Trump and Biden administrations made sure all of those experienced air traffic controllers were fired for not taking the jab. Who needs experienced people when computers fail, right?
Of course this means a long night of videos on the news of people acting like fools, so buckle up.